6.2 Deployment
-
Single machine
The Auany, GlobalId, Switcher and the Provider provided by the application could run on the one machine. Usually, the development environment is like this.
-
Small scale
The Auany and the GlobalId could merge together and run on the one machine.
In the condition that the load of the application is not too heavy and the connection number is not too much, it could copy the Manager and Switcher elements in the configuration file of the Switcher to the configuration file of the Provider, and set the remoteIp of the Manager element in the Provider element as the 127.0.0.1. In this condition, when directly launching the Provider, the Switcher server will be launched on the same java virtual machine, the data transfer execept for the control protocol between the Switcher service and the Provider service will be bypassed to improve the execution performance.
-
Large scale
Individualy run the Auany.
Run multiple Switcher servers.
Configure the Provider, connect multiple Switcher servers, and support various Endpoint to access.
-
Matters need attention
-
Correctly assign the PVID
The PVID must be correctly assigned under the same operating environment. A Provider corresponds to an unique PVID. The whole environment allows to assign 2^24 PVID.
The design of the Endpoint determines that a complete application allows mutiple Provider to provide the service. The large-scale application should use the vertically divided design to resolve the load issue.
The framework determines that the operating environment could design and provide the public Provider solution which is integrated by each application. We suggest that this kind of solution provides the implementation of the Variant mode or script mode for the convenience of the integration.
-
GlobalId
In principle, one GlobalId should correspond to an application. If the assignment specification of a group name between the mutiple applications could be promised, sharing a GlobalId is acceptable.
-
The underlying database
If only a Provider is required to provide the zdb service in all the Provider of an application, it is proper to use the EDB underlying database because it could provide a relatively high storage efficiency. If an application need to provide the ZDB service in multiple Provider, it should consider that each ZDB connects to the same MYSQL server or MYSQL cluster for the convenience of the maintainance.
-
The log system
The Trace is used to record the system log and not proper for the heavy load log recording. We suggest to use the log4j to record the appliction's own log.
-
6.3 Running status monitoring
The system uses JMX to provide the ability of the running status monitor.
It is divided into the independent service monitoring and the data collection to the server set.
-
Independent service mornitoring
Use the switcher server as the example:
Launch the switcher server
Run the jconsole program in the bin directory of the jdk, and create the connection. There are the contents like the below:
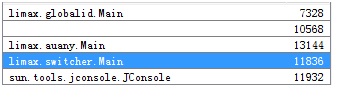
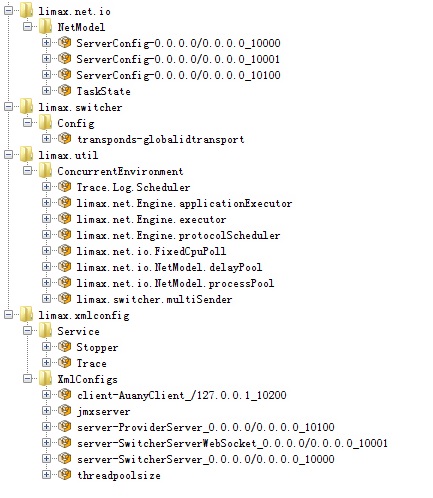
Connect the limax.switcher.Main service, and switch to the MBean TAB page.
There are a serial mbean messages related to the limax.
All relative data of the operation could be viewed here.
The local connection is created here. If the remote connection mode is used, it needs to configure the JmxServer parameters for the relative server, set the serverPort and rmiPort in the service configuration of the switcher.
<JmxServer rmiPort="10002" serverPort="10003"/>
Corresponds to the url:
service:jmx:rmi://localhost:10003/jndi/rmi://localhost:10002/jmxrmi.
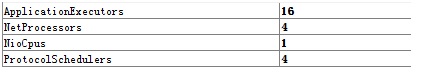
The Jconsole uses the graphic UI to directly present the mbean data, however it is not beneficial for the log analysis. If necessary, the data text could be gotten through the simple tools provided by the limax.jar. For example, to obtain the last threadpoolsize data in the previous figure, this command could be executed:
java -jar limax.jar jmxtool attrs -c "service:jmx:rmi://localhost:10003/jndi/rmi://localhost:10002/jmxrmi" -b "limax.xmlconfig:type=XmlConfigs,name=threadpoolsize"
The below results will be gotten:
4 ProtocolSchedulers
16 ApplicationExecutors
1 NioCpus
4 NetProcessors
which is consistent with the data viewed in the Jconsole:
The query sub-command of the java –jar limax.jar jmxtool.
domains: obtain the JMX Domain registered to the server
mbeans: query all the mbean Name registered to the server
attrs: query the mbean attribute, refer the example above
-
Data collection of the common server set
Use the monitor sub-command of the jmxtool, and provide an interface class which implements the limax.util.monitor.Collector as the parameter. When running monitor, this class's object is created and interactived via the interface of the limax.util.monitor.CollectorController to implement the collection.
-
Example
A testmonitor application in the demo directory is provided as the example. The AuanyCheckPointMonitor.java collects the data related to the Checkpoint of the Zdb of the auany server. First run the auany server, then execute ant run command to collect the data. The example executes the collection with the 30s period and last for one minute. The result is as below:
[java] Sat May 09 02:59:24 CST 2015 localauany limax.zdb:type=Zdb,name=Checkpoint
[java] CountMarshalN 174
[java] TimeOfNextFlush 2015-05-09 00:04:40.691
[java] TotalTimeFlush 7391194
[java] PeriodCheckpoint 60000
[java] TotalTimeMarshalN 16099374
[java] TotalTimeCheckpoint 0
[java] TimeOfNextCheckpoint 2015-05-09 02:59:49.095
[java] CountMarshal0 0
[java] CountSnapshot 0
[java] CountFlush 0
[java] CountCheckpoint 174
[java] TotalTimeSnapshot 14960553
[java] Sat May 09 02:59:54 CST 2015 localauany limax.zdb:type=Zdb,name=Checkpoint
[java] CountMarshalN 175
[java] TimeOfNextFlush 2015-05-09 00:04:40.691
[java] TotalTimeFlush 7408422
[java] PeriodCheckpoint 60000
[java] TotalTimeMarshalN 16151422
[java] TotalTimeCheckpoint 0
[java] TimeOfNextCheckpoint 2015-05-09 03:00:49.145
[java] CountMarshal0 0
[java] CountSnapshot 0
[java] CountFlush 0
[java] CountCheckpoint 175
[java] TotalTimeSnapshot 14986577
[java] Sat May 09 03:00:24 CST 2015 localauany limax.zdb:type=Zdb,name=Checkpoint
[java] CountMarshalN 175
[java] TimeOfNextFlush 2015-05-09 00:04:40.691
[java] TotalTimeFlush 7408422
[java] PeriodCheckpoint 60000
[java] TotalTimeMarshalN 16151422
[java] TotalTimeCheckpoint 0
[java] TimeOfNextCheckpoint 2015-05-09 03:00:49.145
[java] CountMarshal0 0
[java] CountSnapshot 0
[java] CountFlush 0
[java] CountCheckpoint 175
[java] TotalTimeSnapshot 14986577
BUILD SUCCESSFUL
Total time: 1 minute 1 second
-
The development interface
Collector interface: (the collection application must implement this interface)
-
void onController(CollectorController controller) throws Exception;
After the collection object is created, this method is called so that the collection object obtains the collector controller. The usage of the controller refers to the follow-up.
-
void onRecord(String host, ObjectName objname, Map
After the Monitor collects the Jmx data, this method is called. This method identifies the host name, Mbean and the attribute data under the Mbean. This method is the key method of the collection, where the data content could be stored to the database to be used by the subsequent analysis. During the execution of the Monitor collection, a cycle collection of a host is assigned to a thread. This method could be parallelly called, so the collection application itself should consider the synchronization issue.
-
default void onException(String host, Exception e){}If the exception appears during a host's collection, this method is called and the exception is reported to the collection application. It is noted that the collection in this case would not stop. For example, the network issue causes the failure of a host's collection. After the issue is fixed, the subsequent collection tasks will continue correctly. This method could be parallely used.
CollectorController interface: (collection application use it to manage the collection behavior)
-
Runnable addHost(String host, String url, String username, String password) throws MalformedURLException;
This method addes the host configuration. When the username is null, it means no authentication. The run is called on the returned Runnable object so that the host configuration is deleted and all the collections of this host are cancelled.
-
Runnable addCollector(String host, String pattern, long period) throws MalformedObjectNameException;
This method addes a collection to a host. Before calling this method, it should ensure that the host has been successfully added via addHost and not been cancelled. The parameter pattern use wildcard according to the ObjectName's template format to match multiple actual ObjectName. The parameter period with the milliseconds as the unit determines the collection frequency. The run is called on the returned Runnable object and this collection configuration is cancelled.
-
void stop();
This method synchronously stop the entire collection process. After return, all the methods of the Collector interface would not be called and it is safe to clear the collector.
-
-
-
The data collection of the server set related to the application
The collection related to the application is the special mode of the common collection, which is linked to the monitorset defined in the xml of the application. The generated relative collection source code could more accurately program for collection.
The limax.util.monitor.MonitorCollecotor implements the CollectorController interface mentioned previous, inner creates the Collector interface object, and distributes the Jmx relative data collected by the Collector.onRecord to the collection objects of the collector added by the MonitorCollector.addCollectorInstance.
The object added by the addCollectorInstance must implement the Collector interface in the generated source code of the monitorset defined in the application xml.
For example: the uany.xml defines the monitorset of the AuthProvider. The interface definition of the AuthProvider.Collector could be found in the generated source code. The onRecord defined in this interface according to the order of the collected host name, the key defined by the monitorset, the counter defined by the monitorset accurately reproduces the parameter type.
mc.addCollectorInstance((AuthProvider.Collector) (host, platflag, pvid, _newaccount, _auth) -> {
    System.out.println("host = " + host + " platflag = " + platflag
        + " pvid = " + pvid + " newaccount = " + _newaccount    + " auth = " + _auth);
});
Through the method above, add the collection object instance to implement the typed collection.
Please refer the AuanyAuthMonitorAPI.java in the testmonitor for the detailed information.
-
Collection data stores to the database directly
In some running environment, it needs to store the collection data to the database directly to be analyzed in the future.
The feature is supported by limax.util.monitor.MonitorCollecotor.addSQLExecutor method. Please refer the example AuanyAuthMonitorDB.java in the testmonitor for the detailed information.
Constructing the MonitorCollector with the onexeception parameter, all the exceptions in collect process will be collected via onexeception.
This is a sample implementation and performs the synchronization on the connection. In the actual usage, if collecting data is frequent and the sum of collected hosts is big, it might be the bottleneck. In this case, the connection pool should be considered, through using try/finally mode. The connection is obtained before try, the sql.accept(conn) is called in the try block, and the connection is recycled in the finally block. It is no need to catch the exception because through constructing the MonitorCollector with the onexeception as the parameter, all the exceptions will be collected via oneexception.
Checking the generated AuthProvider.Collector source code, it is noted that there are two static methods getCreateTableString and createInsertStatement provided by the internal interface. After the collection application launches, it tries to create the table in the database according to the SQL statement returned by getCreateTableString before the first inserting data, and ingore the creation error. That means if necessary, the table could be pre-created according to the requirements. The name and baisc field description of the table are in the createInsertStatement method. The table defined by the user only need to ensure that the name and baisc field description of the table exist. Except for the host, these names come from the description of the monitorset and the undscore is added in the front of the name to avoid the conflict with the reserved word of the database. In addition, the getCreateTableString returns the CREATE TABLE statement which matches the specification of the Mysql. If the other database is used, please refer the sample to pre-create the table. The INSERT statement used by the createInsertStatement is standard and the database compatibility problem does not exist.